Tags
Language
Tags
July 2025
Su Mo Tu We Th Fr Sa
29 30 1 2 3 4 5
6 7 8 9 10 11 12
13 14 15 16 17 18 19
20 21 22 23 24 25 26
27 28 29 30 31 1 2
    Attention❗ To save your time, in order to download anything on this site, you must be registered 👉 HERE. If you do not have a registration yet, it is better to do it right away. ✌

    https://sophisticatedspectra.com/article/drosia-serenity-a-modern-oasis-in-the-heart-of-larnaca.2521391.html

    DROSIA SERENITY
    A Premium Residential Project in the Heart of Drosia, Larnaca

    ONLY TWO FLATS REMAIN!

    Modern and impressive architectural design with high-quality finishes Spacious 2-bedroom apartments with two verandas and smart layouts Penthouse units with private rooftop gardens of up to 63 m² Private covered parking for each apartment Exceptionally quiet location just 5–8 minutes from the marina, Finikoudes Beach, Metropolis Mall, and city center Quick access to all major routes and the highway Boutique-style building with only 8 apartments High-spec technical features including A/C provisions, solar water heater, and photovoltaic system setup.
    Drosia Serenity is not only an architectural gem but also a highly attractive investment opportunity. Located in the desirable residential area of Drosia, Larnaca, this modern development offers 5–7% annual rental yield, making it an ideal choice for investors seeking stable and lucrative returns in Cyprus' dynamic real estate market. Feel free to check the location on Google Maps.
    Whether for living or investment, this is a rare opportunity in a strategic and desirable location.

    Enhancing Power BI with Visio Visuals

    Posted By: IrGens
    Enhancing Power BI with Visio Visuals

    Enhancing Power BI with Visio Visuals
    .MP4, AVC, 1280x720, 30 fps | English, AAC, 2 Ch | 45m | 113 MB
    Instructor: Scott Helmers

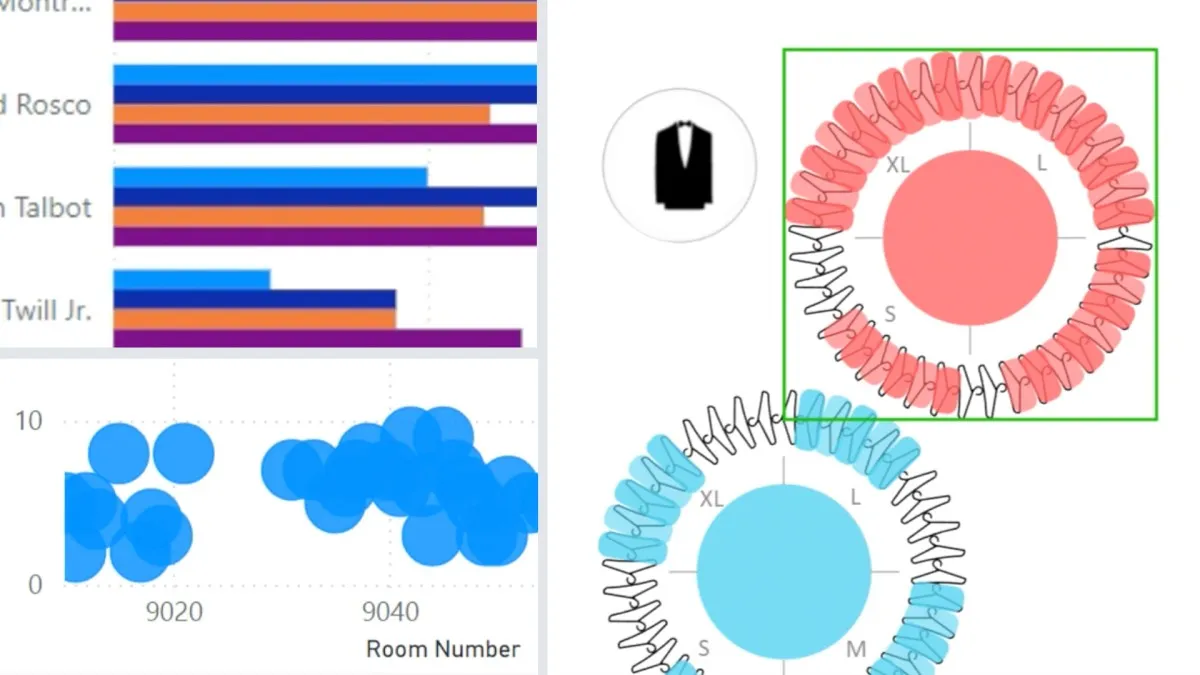
    In this course, Scott Helmers—a partner with the Harvard Computing Group (HCG)—shows you how to enhance your data visualizations by integrating Microsoft Visio with Power BI. Explore ways to combine Visio's detailed diagrams with Power BI's dynamic data visualization capabilities to create comprehensive, interactive reports. Practice embedding Visio diagrams in Power BI reports. Discover techniques for adding and configuring Visio visuals within Power BI, learn to leverage Visio's shape data for enhanced interactivity, and find out how color-coding and text annotations can visualize data dimensions directly within your diagrams.

    This course is designed for data professionals, analysts, and anyone interested in elevating their data presentation skills. By the end of this course, you'll be equipped to create visually rich, interactive reports that provide deeper insights into your data, helping stakeholders understand complex information at a glance.


    Enhancing Power BI with Visio Visuals