

Udemy – Transform your excel lists into powerful data-driven apps

Udemy – Transform your excel lists into powerful data-driven apps
WEBRip | MP4/AVC, ~444 kb/s | 1280 x 720 | English: AAC, 56.9 kb/s (2 ch), 48.0 KHz | 318 MB
Genre: Office Productivity / Microsoft | Language: English | +Project Files
WEBRip | MP4/AVC, ~444 kb/s | 1280 x 720 | English: AAC, 56.9 kb/s (2 ch), 48.0 KHz | 318 MB
Genre: Office Productivity / Microsoft | Language: English | +Project Files
Data is everywhere, from databases to excel spreadsheets. Data is the future. Data is the new oil. Data is here and here to stay. We need to start making more sense out of our… Data.Most of us in the field, where data is used to help the decision making process, have sometimes wondered if things could be more effective and efficient. This course will be your guide to fulfill that need. Be more productive, be more insightful and above all be on top of the "data game" you need to play these days.
Using state of the art technology and methods, you will be able, when you finish this course, to become the trusted advisor for your senior management or even better your CEO or CFO. Advance your career by gaining knowledge in the area of data handling, visualization and analysis.
You could be the one bringing innovative solutions to your companies' data environment and practice. Showing your company what they didn't know just yet, is your strategy to provide them with real and relevant value added data solutions.
What are the requirements?
- Have a real interest in developing data-driven solutions
- Have at least windows 7 or 8 64-bit OS
- Have at least 4 GB RAM available
- 500 MB disk space required to install
- Local admin privileges to install the software (Qlik Sense)
- Excel isn't the only source you could use for solutions taught in this course
What am I going to get from this course?
- Over 21 lectures and 2 hours of content!
- Know how to use state of the art technology with your data
- Loading data from excel spreadsheets for fast and rich analysis
- Transforming and enriching data
- Calculating with / and using functions
- Creating powerful and intuitive designed analysis apps
- Creating and designing charts and other visualizations
- Understand how an analysis flow or tree can be designed
- Understanding how information design can help to get insights accross
- Translating (business) requirements into data-driven solutions
- Really speed up your data analysis practice and make better use of your data in excel sheets or other (delimited) file formats
What is the target audience?
- People who like to advance their career in data analytics
- People who are familiar with excel and want to do better analysis
- Students graduating with an informatics, math, economics or business oriented background
- Business analists, financial and/or business controllers
- IT professionals looking to help their business' need for information
- Accountants and/or business related advisors
- And all other people interested in information management in general
- Auditors who would like to advise their customers better data practices
- The course is aimed towards beginners for advanced data solutions, but is really for anyone who wants to get a better and deeper understanding of information design and data analytics in general
- People who want simple and fast insights into data analytics
- People who practice BI development in their daily routine might not benefit from the data handling part of the course. The visualization, business value, analysis and design part could still be interesting to have a look at
Curriculum
Section 1: Introduction
Lecture 1 Introductory course overview Preview 03:35
In this lecture you will be presented the following:
- Who Am I?
- Why this course?
- What will you be learning?
- Why would you want this course?
Section 2: Getting started
Lecture 2 Installing the software Text
Here you will see how to install Qlik Sense, the solution we are going to cover our courses with.
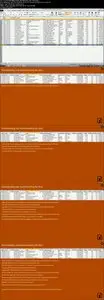
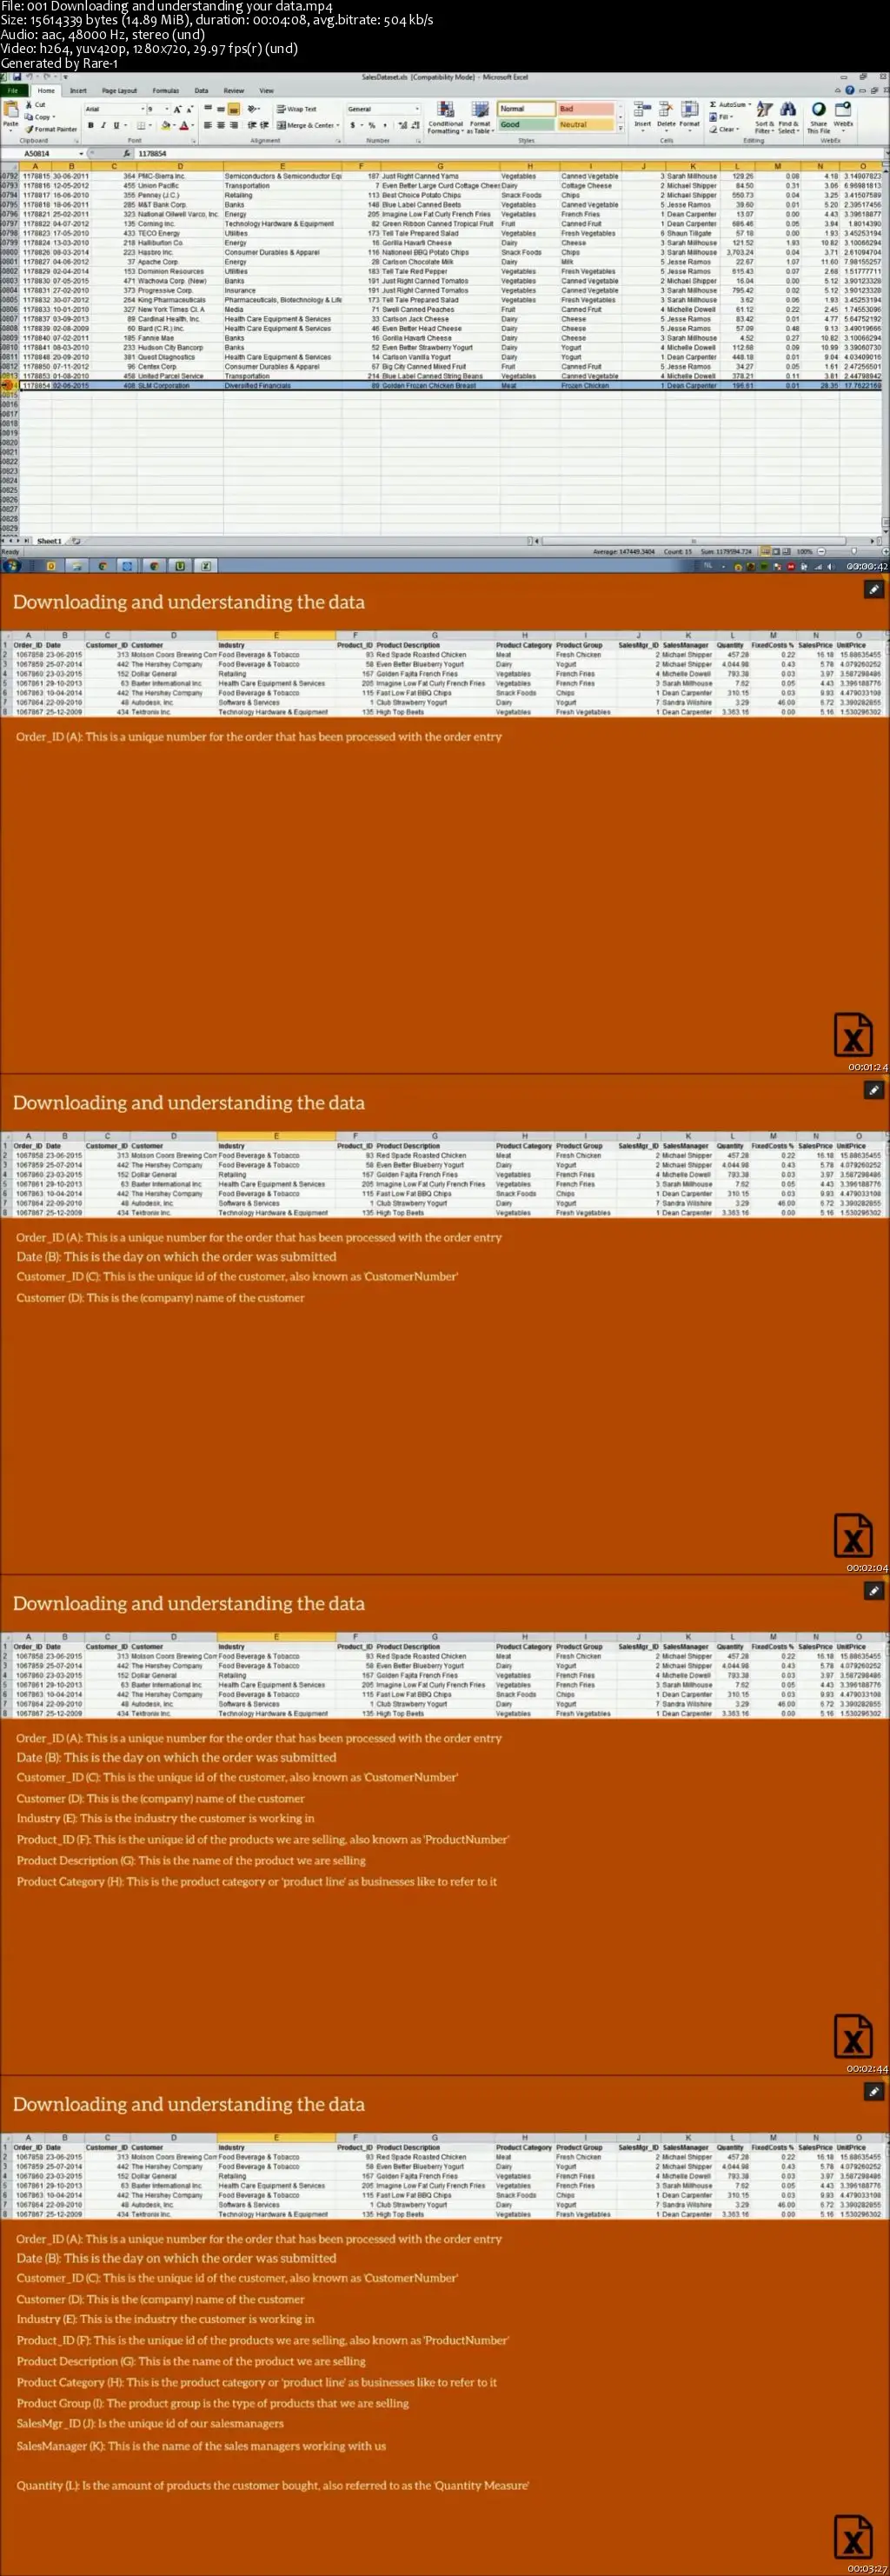
Lecture 3 Downloading and understanding your data 04:08
This lecture is aimed at getting familiar with the data once you have downloaded it. There will be a document which describes what the data means and how we can work with that data once we have loaded the data into our first application.
Lecture 4 Loading the data Preview 02:36
Here I will show how to load the data into the application so you can start working with it.
Section 3: Playing around with some concepts
Lecture 5 Exploring your data and associations 06:10
Exploring your data and potentially spot some interesting information without creating charts is what we will cover in this lecture.
Lecture 6 Create your first visualization 05:17
This lecture will help you to understand what you can achieve with using charts and data visualization in general. It will introduce you to the basic concepts of how it can help to produce insight from your data.
Lecture 7 Bookmarking and using search 04:24
Using these capabilities will help you in your real world situations to get the most out of the data-driven solutions you create.
Section 4: Understanding the process
Lecture 8 Adding data files or tables to your existing data 04:19
This lecture will cover the basics of data modeling for only the purpose of this course. Helping you with that will help you achieve the goals of the overall course.
Lecture 9 Transformation and enrichment of your data 06:53
In this lecture I'll be showing you how to transform and/or enrich data. This will give you a better understanding of how to use the solution to create powerful and effective solutions.
Lecture 10 Creating master items 06:15
This one will show you how to create data elements and calculations only once. You will see why this is useful after you finish this lecture.
Section 5: Designing your user interface
Lecture 11 Designing an analysis logic with a top-down approach in mind 04:56
You will learn to understand how to arrange or organize your data for better comprehension. This will also allow you to design applications that make sense from a user perspective.
Lecture 12 Page content and layout 06:15
You will learn how to organize and position your content in your UI. This is key for users for being able to quickly scan and find information that is important to them.
Lecture 13 Designing information and visualizations 06:51
Working with your data at this level will really help you to create potential number crunchers. Pay attention here and you will gain lots of understanding about data sense making in general.
Section 6: Example app development
Lecture 14 Loading data and creating master items 07:01
In this lecture I will present a screen capture video on how to load your data. After this data is loaded into the app, you will see how to implement measures and dimensions into the master items, (read: categories and properties of an event) a central repository, with reusable items in your app.
Lecture 15 Adding fields for year, month and week 04:50
This lecture will show you how to enrich your data with the fields:
- Year
- Month
- Week
- YearMonth
Lecture 16 Creating the dashboard 06:04
In this lecture I will develop a dashboard on the fly. This will help you to get started with dashboard creation and design when you develop these solutions yourself.
Lecture 17 Creating an analysis page 05:31
Being able to analyze data means that you need to pay attention to specific visualization techniques and calculations. This lecture will give you an understanding of the basics of creation for data analysis.
Lecture 18 Creating a page with detailed insights 03:59
When you want to get to the actionable insights of any finding, you need to be able to dive into the nitty gritty details of that finding. This exercise will show you how it can be done in a simple manner.
Lecture 19 Adding design for comprehension 09:56
Want to make it easier for yourself understanding the data and be able to share these insights for the same comprehension? This is the lecture that will help you to understand how that works.
Section 7: Performing analysis
Lecture 20 Answering questions for your business Preview 04:57
Here you will learn to translate business questions into insights. Being able to answer questions you get from within the business is the general purpose for every data-driven solution.
Lecture 21 Using the interactive behavior of your solution to the max 06:18
Here you will learn about how to use the more interesting capabilities of your solution to get a maximum result when it comes to analyzing your data.
Section 8: Take aways
Quiz 1 Recap questions 20 questions
Udemy – Transform your excel lists into powerful data-driven apps
LabView - Collective Books
Mega E-books Pack (2013)
Malware Centric E-book Collection
Huge Electricity, Magnetism, A..., Healing - EBooks Collection
Premium IT eBooks Collection
Huge Encyclopedias - EBooks Collection
Osprey Publishing - Military History Books Collection
Gale Encyclopedias - Full Pack
IT Books Collection (Basic - Intermediate - Advance)
Medicinal and Aromatic Plants - 50 Volume Set
Doctor Who ebooks Collection
Learning HTML Ultimate Collection
Comprehensive Robotics Books Collection
Great Royal Web Design Pack
Civil Engineering Geotechnical books
Luftwaffe Colours Collection
Many Thanks to Original uploader.
For More Rare Movies Check out my blog!
Download Links:
No Mirrors Please