Mastering Data Visualization with R (2016)
Mastering Data Visualization with R
September 2016 | MP4 | Video: AVC 1280x720 | Audio: AAC 44KHz 2ch | Duration: 1 Hours 43M | 401 MB
Genre: eLearning | Language: English
September 2016 | MP4 | Video: AVC 1280x720 | Audio: AAC 44KHz 2ch | Duration: 1 Hours 43M | 401 MB
Genre: eLearning | Language: English
Learn how to create advanced data visualizations with R in order to transform your data into actionable insight.
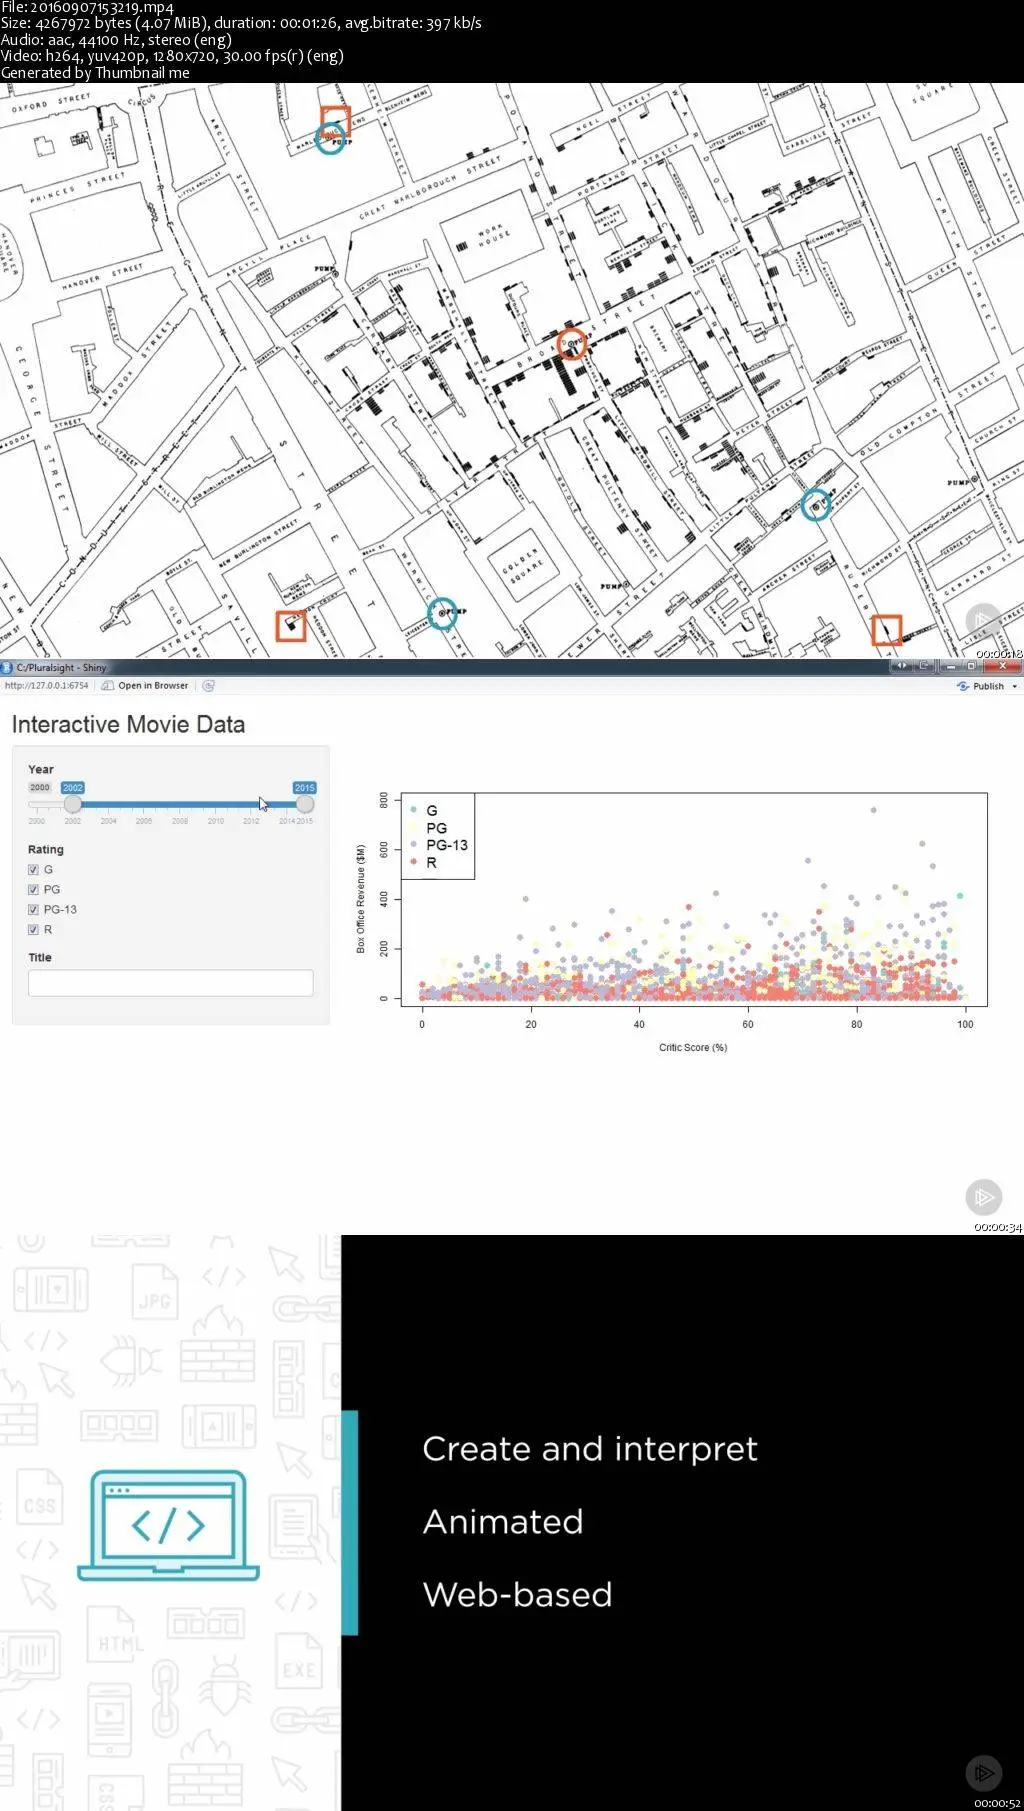
R is a popular open-source programming language for data analysis. Its interactive programming environment and data visualization capabilities make R an ideal tool for creating a wide variety of data visualizations. In this course, Mastering Data Visualization with R, you will learn how to answer questions about your data by creating advanced data visualizations with R. First, you'll learn how to create and interpret data visualizations that involve spatial data, hierarchical data, graph and network data, and textual data. Then, you'll learn how to create animated data visualizations. Finally, you'll learn how to create web-based interactive data visualizations using a framework called Shiny. By the end of this course, you'll have the skills necessary to create and interpret a variety of data visualizations using R.
Mastering Data Visualization with R (2016)