Excel Case Studies: Sales Reporting with Pivot Tables/Charts

Excel Case Studies: Sales Reporting with Pivot Tables/Charts
MP4 | Video: 1280x720 | 78 kbps | 48 KHz | Duration: 4 Hours | 883 MB
Genre: eLearning | Language: English
MP4 | Video: 1280x720 | 78 kbps | 48 KHz | Duration: 4 Hours | 883 MB
Genre: eLearning | Language: English
Via an authentic case study in business sales reporting, learn Excel functions for pivot tables & charts, IF & VLOOKUP.
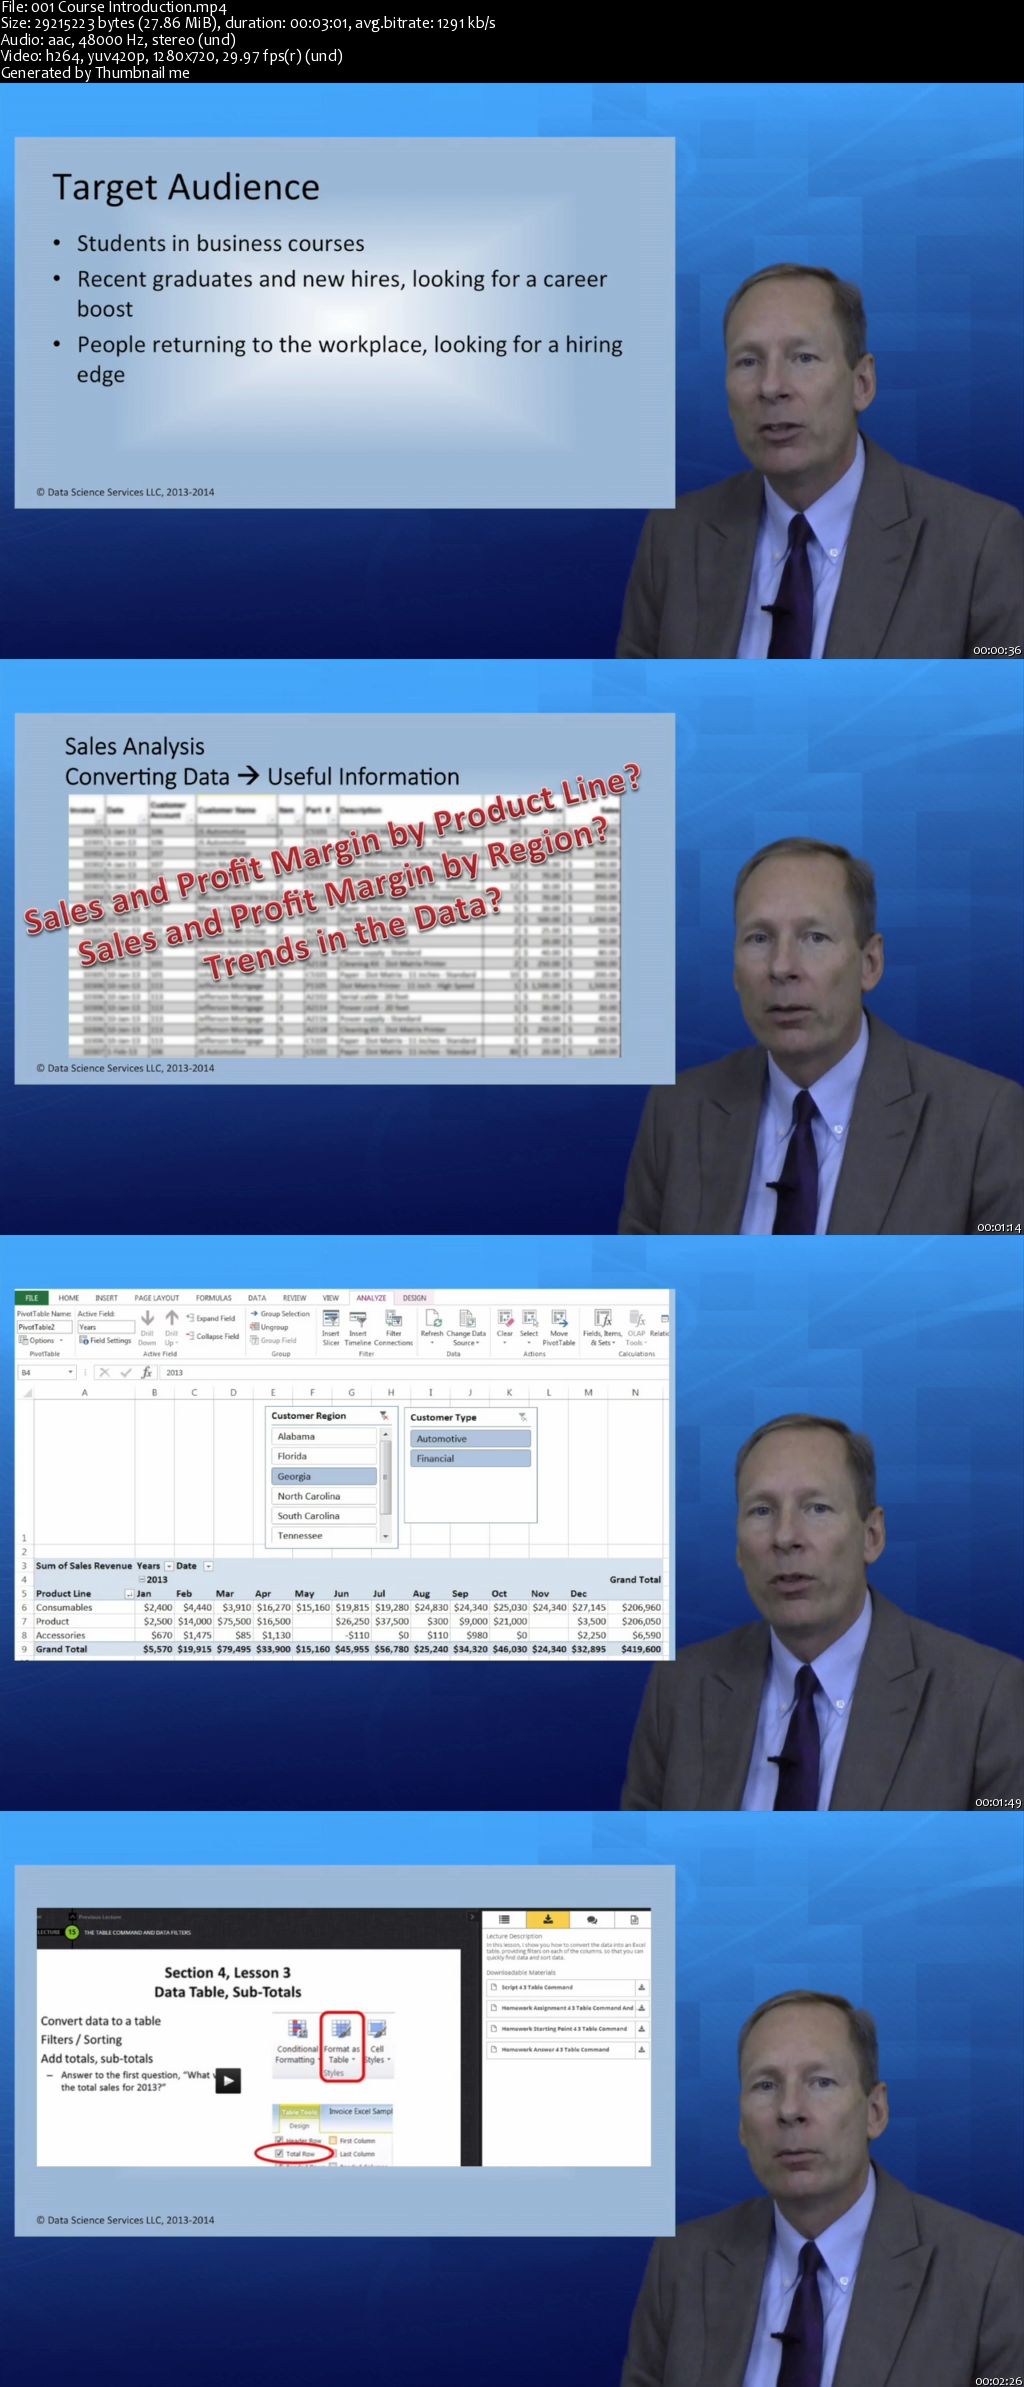
Another Excel Course?!? How is this one different? This course is not just a list of Excel functions. Yes, it does teach the critical Excel functions like IF, VLOOKUP, and pivot tables and charts, but it does so through an extended case study example of sales reporting and analysis. So you'll learn WHY these functions are important, and how to use them to answer real business questions. You'll learn them by seeing them used in action to answer questions, like "Who is the top customer?" and "What are the top-selling products?" How do I know? I'm a senior executive, and a hiring manager, at a high-tech manufacturing company.
In this course, you are a business analyst, given the task of analyzing the sales results for a small company, to answer questions about sales and profitability. The lessons show the Excel functions in detail, highlighting each step. I provide the scripts for each lesson, along with the Excel file used, both the starting point and finishing point. I provide everything I can to make this course a success for you!
The course starts with a basic set of raw data. First I show you how to format the raw data, adding product lines, customer regions, and product cost, using IF and VLOOKUP. Then I show you how to summarize the data with advanced pivot table functions, filters, and slicers, to calculate sales and margin by product line by region. Next, I show you how to visually display the results with several different types of charts, and to make a color-coded customer scorecard. Finally, I show you how to write the up the results in a business report.
There is no more practical course on Excel and Business Analytics: this is exactly what business analysts do every day. I learned these Excel techniques over a period of years: you can learn them in a few days. Let's get started!
Excel Case Studies: Sales Reporting with Pivot Tables/Charts