

Lynda - Gantt Charts Explained

Lynda - Gantt Charts Explained
Size: 516MB | Duration: 1h 17m | Video: AVC (.mp4) 1280x720 30fps | Audio: AAC 48KHz 2ch
Genre: eLearning | Level: Appropriate for all | Language: English
Size: 516MB | Duration: 1h 17m | Video: AVC (.mp4) 1280x720 30fps | Audio: AAC 48KHz 2ch
Genre: eLearning | Level: Appropriate for all | Language: English
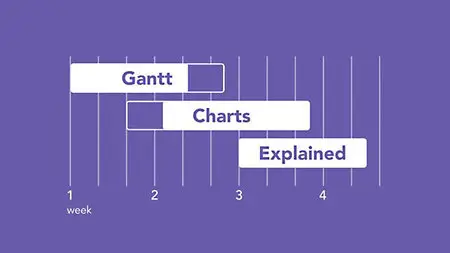
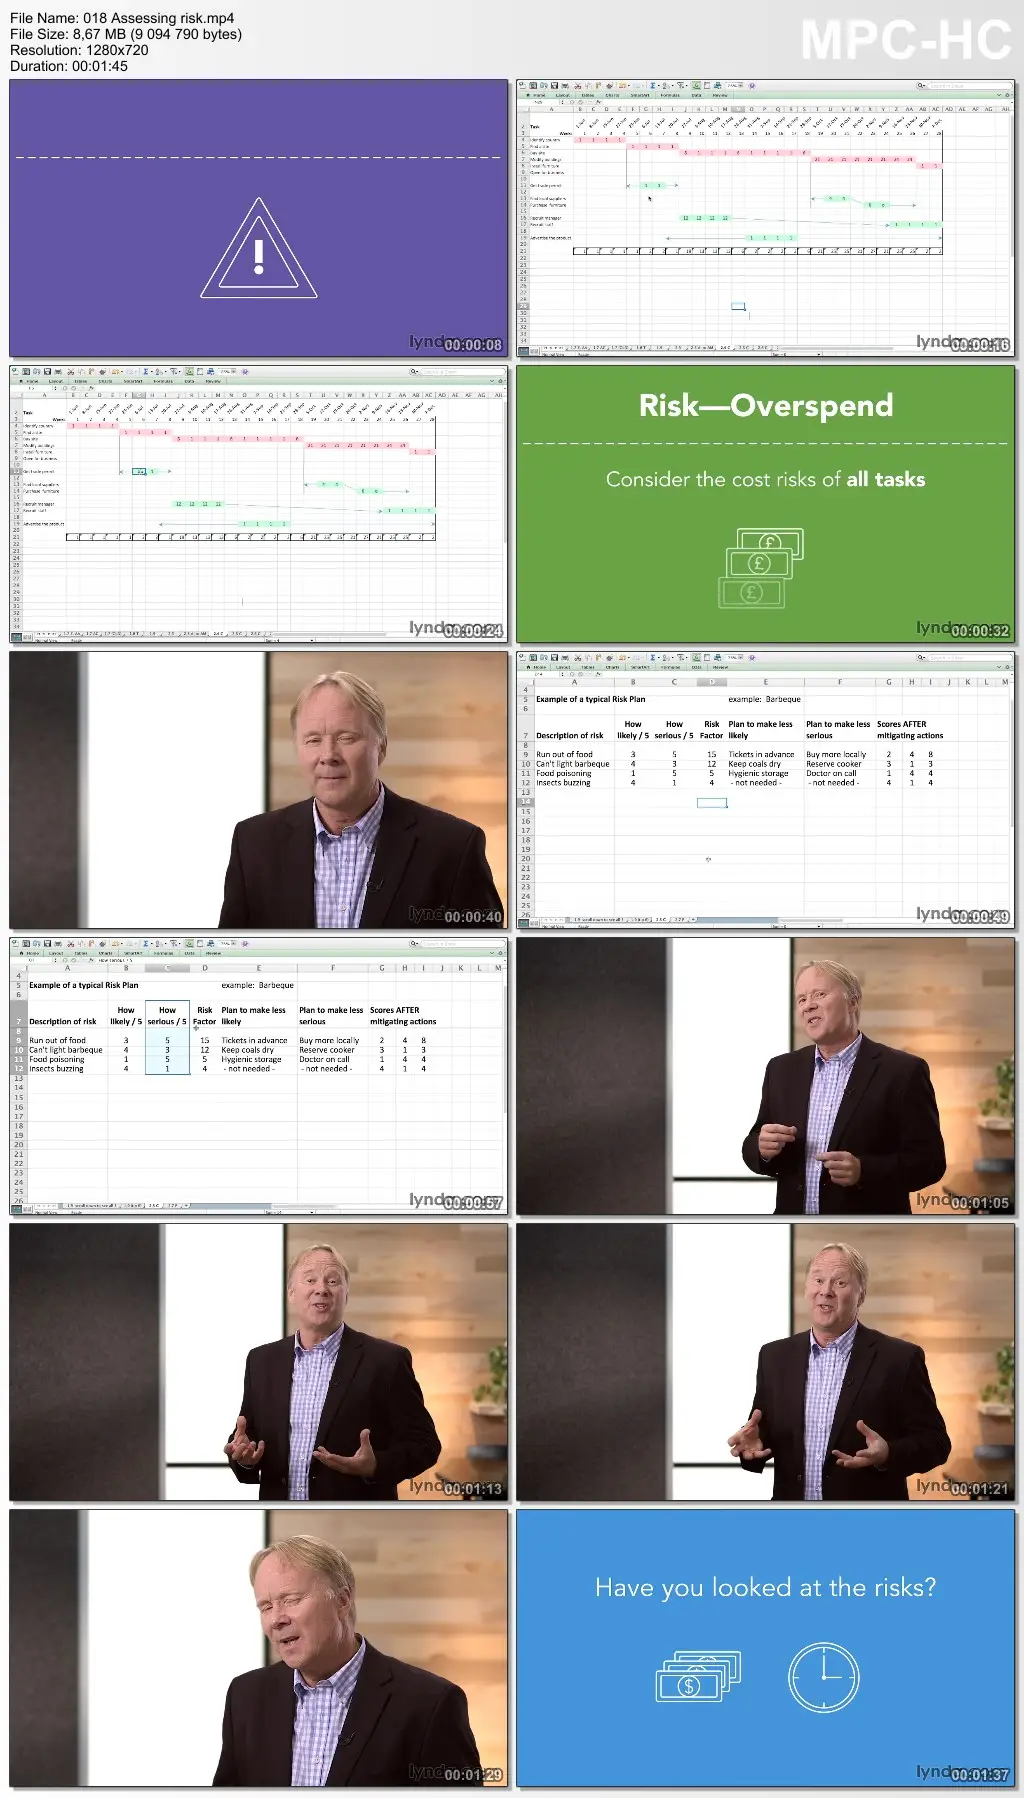
What is a Gantt chart? A Gantt chart is an incredibly helpful way to illustrate the critical deadlines associated with any project—connecting start and end dates of individual tasks and their interdependencies. In this course, project management trainer and Gantt chart aficionado Chris Croft explains how to create and use a Gantt chart for a variety of purposes, using different Gantt chart software. Learn how to create Gantt charts to communicate with customers, plan resources, monitor progress for one or multiple projects, assess risk, predict spend, and decide whether or not you can speed up your project. Chris also discusses the most common problems and provides tips to help you avoid mistakes.
* What is a Gantt chart?
* Estimating times and adding contingency
* Assessing the Gantt chart software options
* Using Gantt chart templates
* Communicating the plan
* Accelerating projects with Gantt charts
* Estimating times and adding contingency
* Assessing the Gantt chart software options
* Using Gantt chart templates
* Communicating the plan
* Accelerating projects with Gantt charts
Lynda - Gantt Charts Explained
No mirrors below please.