

Introduction to Excel for Data Visualization

Introduction to Excel for Data Visualization
WEBRip | MP4/AVC, ~962 kb/s | 1096 x 616 | English: AAC, 27.2 kb/s (2 ch), 22.5 KHz | 226 MB
Genre: Office Productivity / Microsoft | Language: English | +Project Files
WEBRip | MP4/AVC, ~962 kb/s | 1096 x 616 | English: AAC, 27.2 kb/s (2 ch), 22.5 KHz | 226 MB
Genre: Office Productivity / Microsoft | Language: English | +Project Files
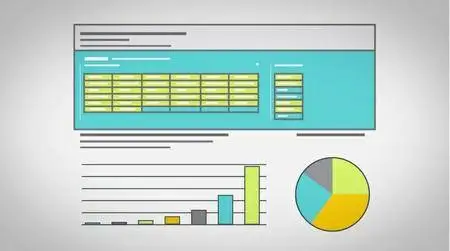
Quick and easy tutorials on Excel's most useful features for data visualization
Excel offers a valuable set of features that can be utilized to meet a wide range of data analysis and visualization needs, and we created an interactive and compelling course to help you rapidly develop these skills.
By the end of this course, you will be able to make beautiful reports and interactive dashboards that best convey your data!
**We also have two MAJOR BONUSES for students who complete this course!**
1. BONUS CONTENT: Students who complete this course will be automatically enrolled in our COMPLETE Excel for Data Visualization course on the TechChange platform, at no extra cost. You'll get an extra hour of course material and learn the following:
- Learn data visualization principles that are critical to making charts with a clear purpose and clean data.
- Apply these principles to three example graphs with detailed step-by-step explanations.
- Explore real-world case studies from the global health and political sectors that employ these techniques.
- Put your Excel skills to the test with scenario exercises
2. A FULL REFUND: Students who complete the course and leave a course evaluation on Udemy will receive a full refund from TechChange. This offer is only for a limited time, so sign-up today before it's gone!
What are the requirements?
- Excel 2010 or 2013 for PC or Mac. This course was recorded using Excel 2013 for PC but all concepts taught are compatible with Excel 2010 as well. Please note that PivotCharts and Slicers are not available in Excel for Mac at this time.
- Desire to learn and explore all that Excel offers!
What am I going to get from this course?
- Over 21 lectures and 55 mins of content!
- Apply time-saving Excel functions and techniques to format columns, tables, and cells (i.e. highlight all blank cells in red)
- Create beautiful reports with pie charts, dot plots, bar, and line graphs
- Modify your charts for clarity and alignment with your brand
- Learn basic VBA, the programming language used in Excel, to write code that will automate repetitive tasks (i.e. abbreviate long country names automatically)
- Use INDEX MATCH and VLOOKUP to find corresponding data entries and locate information quickly
- Use COUNTIF to tally up the number of cells that meet desired criterion (i.e. number of countries with zero viruses)
- See trends in your data with Sparklines
- Learn what a PivotTable is, and why it is a popular choice for displaying more than two fields of data at a time
- Create PivotCharts to quickly analyze data
- Learn about Slicers, which allow you to filter data for multiple charts or tables
- Make dashboards containing tables and graphs that adjust at the click of a button!
What is the target audience?
- Beginning Excel users
- Anyone who wants to touch up on critical Excel functions
- Anyone who wants to build engaging data visualizations
Curriculum
Section 1: Data Cleaning
Lecture 1 Introduction to Data Cleaning 01:15
Lecture 2 Column Formatting 02:21
Lecture 3 Table Formatting 02:12
Lecture 4 Macros 03:37
Lecture 5 Conditional Formatting 04:08
Section 2: Creating a Static Report
Lecture 6 Basic Functions 04:54
Lecture 7 INDEX MATCH 02:45
Lecture 8 VLOOKUP 02:43
Lecture 9 COUNTIF 01:33
Lecture 10 Sparklines 02:39
Lecture 11 Line, Bar, Pie Charts 04:26
Lecture 12 Dot Plot 04:22
Section 3: Making an Interactive Dashboard
Lecture 13 Introduction to Making a Dashboard 01:20
Lecture 14 PivotTables 03:16
Lecture 15 Basic Formatting 02:54
Lecture 16 PivotCharts 01:01
Lecture 17 Slicers 01:09
Lecture 18 Formatting Charts 04:18
Lecture 19 Formatting Slicers 02:59
Section 4: Wrapping Up
Lecture 20 Course Summary 01:01
Lecture 21 Thank You and Next Steps! 01:04
Introduction to Excel for Data Visualization

LabView - Collective Books
Mega E-books Pack (2013)
Malware Centric E-book Collection
Huge Electricity, Magnetism, A..., Healing - EBooks Collection
Premium IT eBooks Collection
Huge Encyclopedias - EBooks Collection
Osprey Publishing - Military History Books Collection
Gale Encyclopedias - Full Pack
IT Books Collection (Basic - Intermediate - Advance)
Medicinal and Aromatic Plants - 50 Volume Set
Doctor Who ebooks Collection
Learning HTML Ultimate Collection
Comprehensive Robotics Books Collection
Great Royal Web Design Pack
Civil Engineering Geotechnical books
Luftwaffe Colours Collection
Many Thanks to Original uploader.
For More Rare Movies Check out my blog!
Download Links:
No Mirrors Please